Query Analytics
Use Query Analytics to review MySQL query activity reported in the Dashboard and choose a query to inspect. Query Analytics shows observed activity, while Query Optimization presents proposed changes.
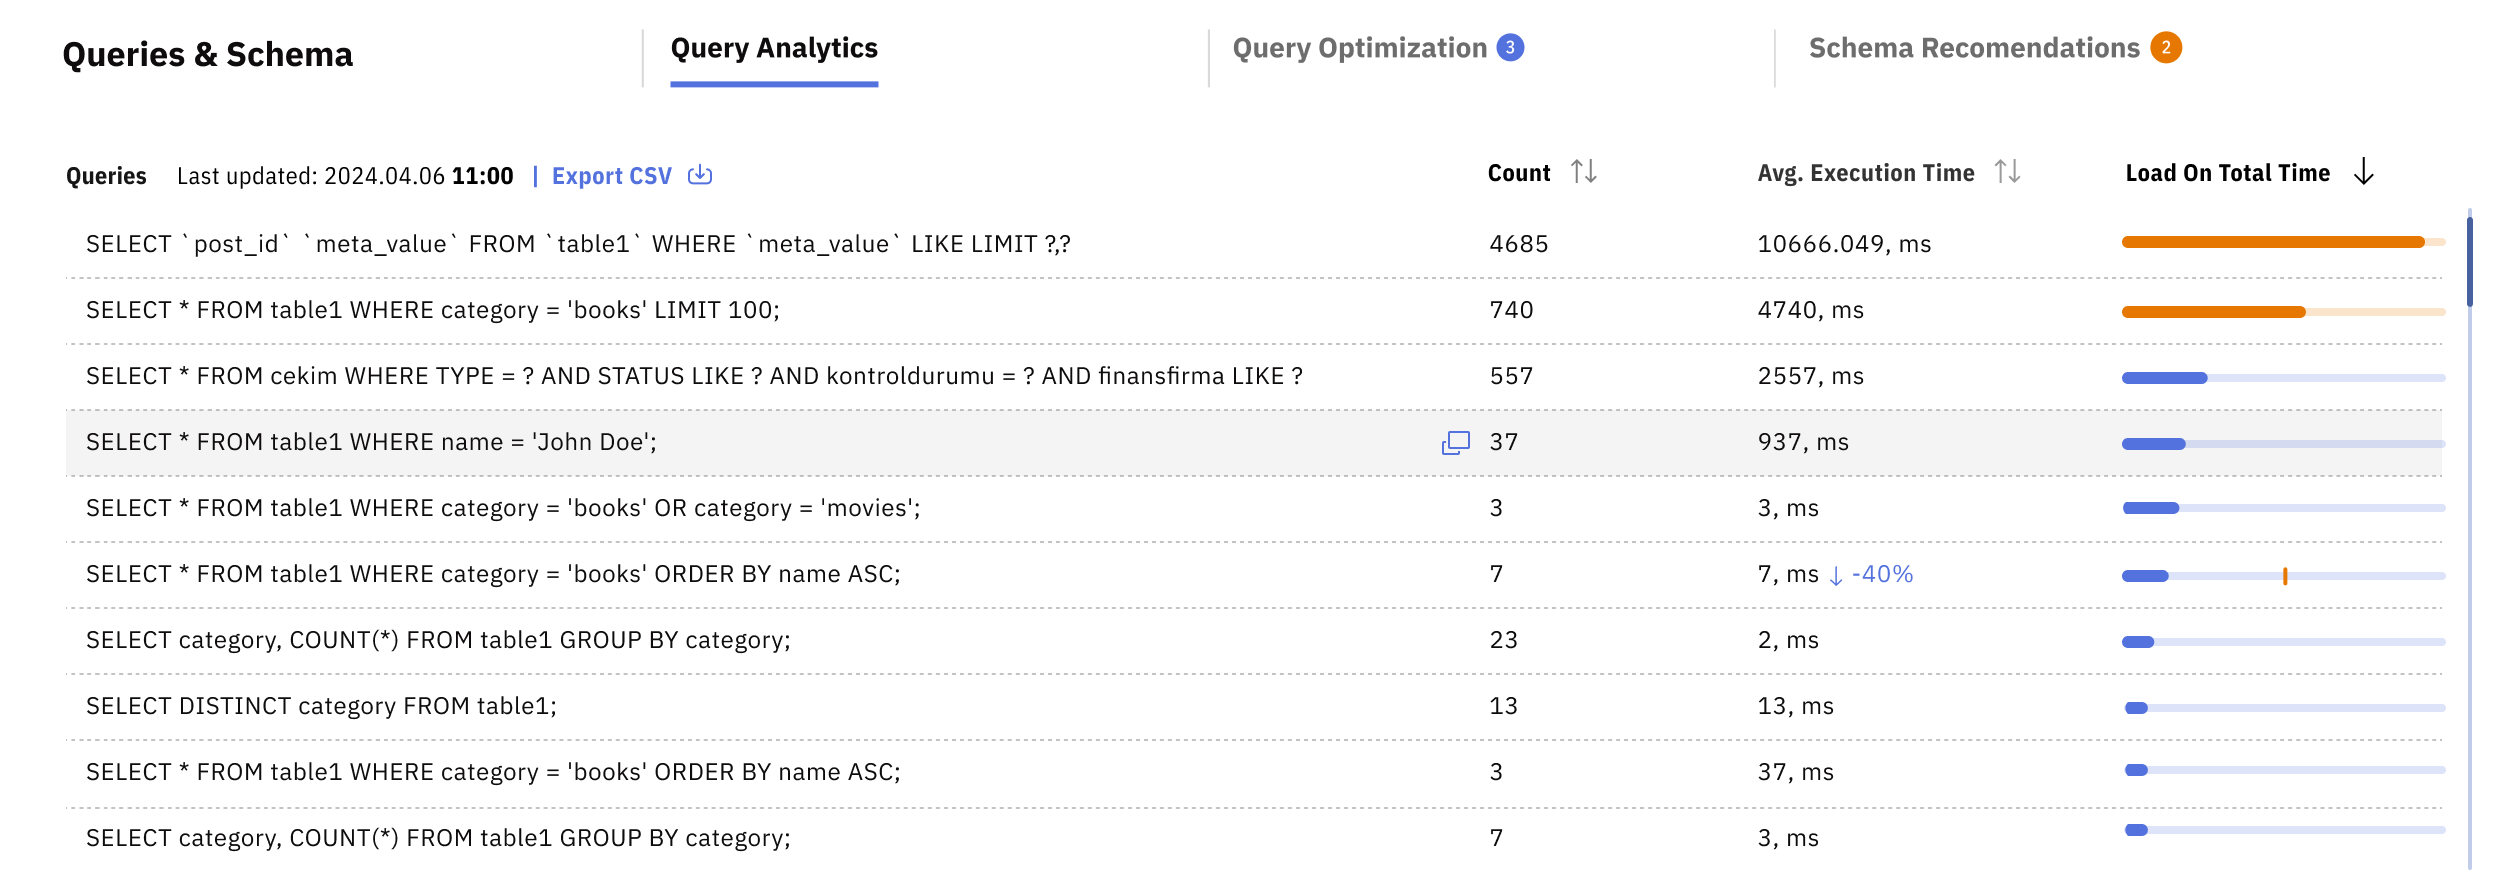
The block includes the following columns:
- Count – A running count of how many times the query has executed since the last server restart.
- Average Execution Time – Shows the average time it takes for each query to execute so you can compare slower-running queries.
- Load on Total Time – Shows the total time consumed by all instances of the query. An orange or blue bar helps you compare the load reported for each query.
- Action – Click on the query or Inspect button to view a specific query in detail.
The following three tasks are alternatives; choose the one that matches what you need to investigate.
Find slow queries
- Find the Query Analytics block on the Dashboard.
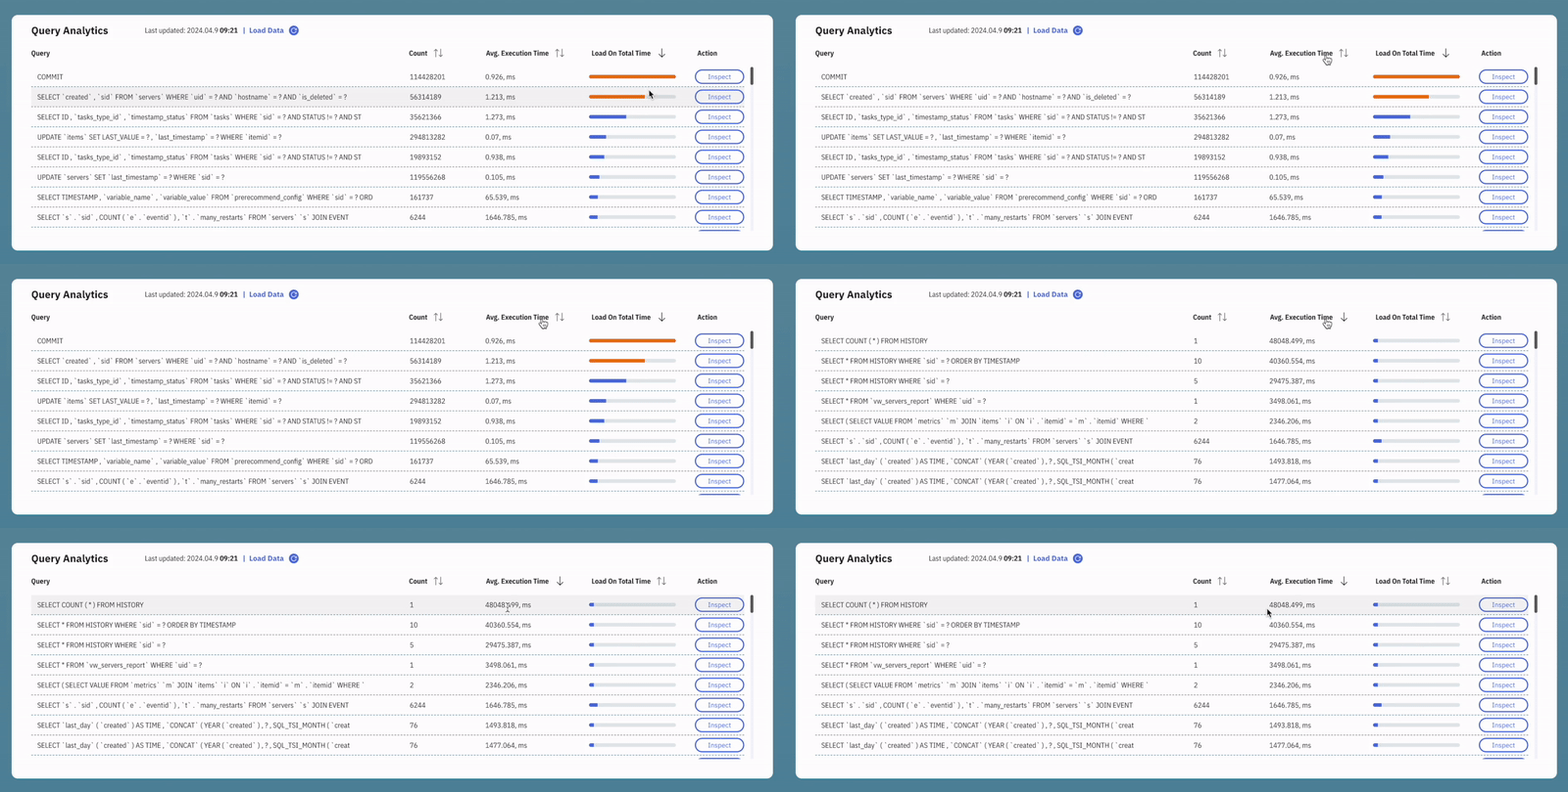
- Click the Avg. Execution Time column heading.
Releem sorts your top 100 queries, with the slowest-executing queries listed at the top.
Find queries with the highest total load time
- Find the Query Analytics block on the Dashboard.
- Click the Load on Total Time column heading.
Releem sorts your top 100 queries, with the queries with the highest cumulative execution time listed at the top.
Inspect query details and request optimization suggestions
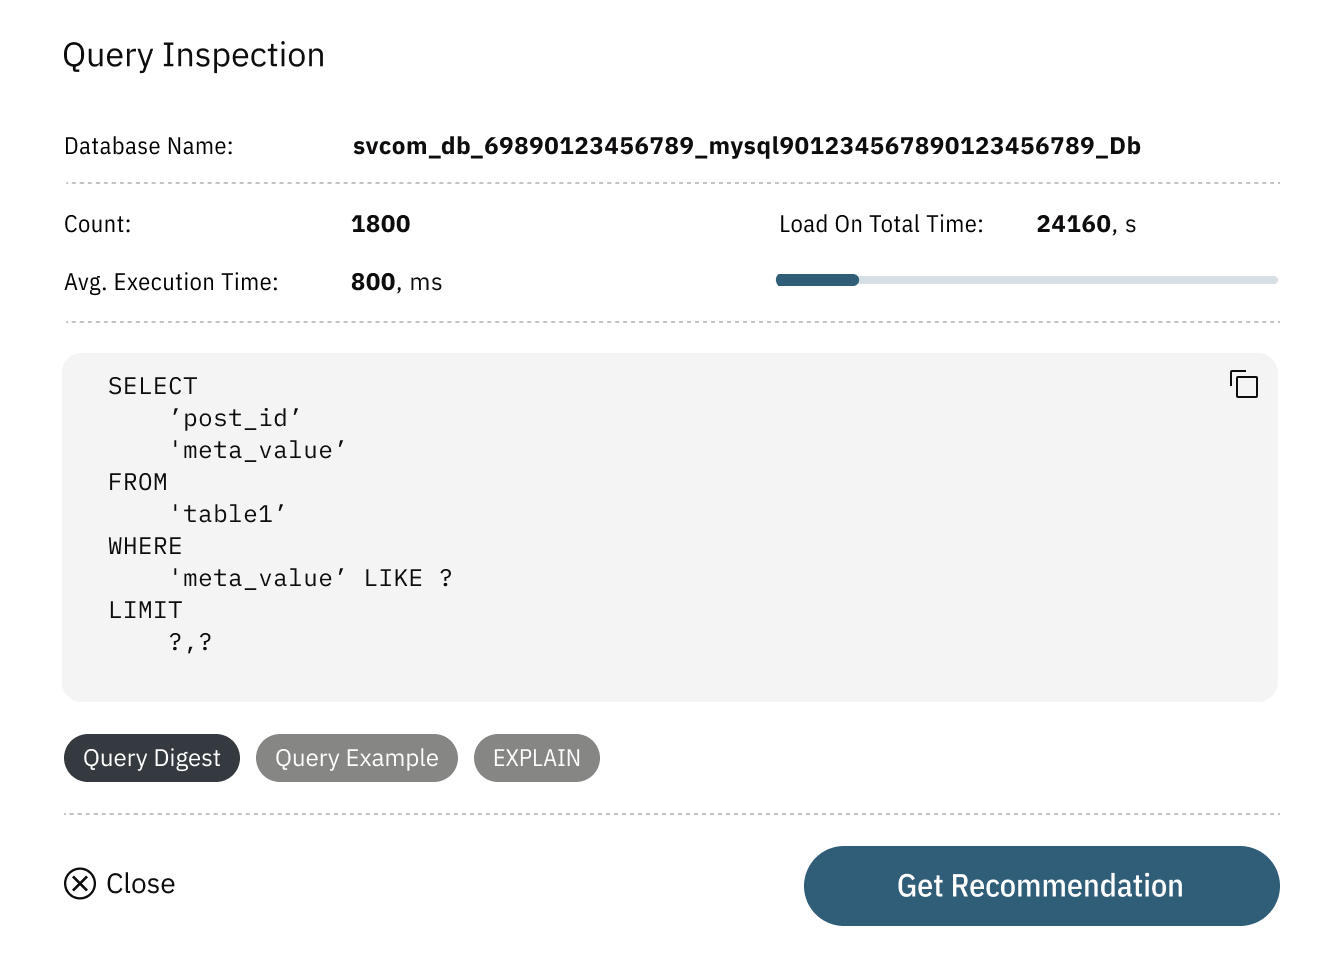
- Click the query in the Query Analytics tab to view the full query statement.
- Click Get Recommendations to get suggestions on query performance optimization and missed indexes.