Health Checks
Use Health Checks to review the MySQL system, storage-engine, memory, query, and log metrics that Releem evaluates. Review a check together with its current value and recent workload before deciding whether further investigation or a configuration change is needed.
Releem groups these metrics into four blocks: System, MyISAM/InnoDB, Memory, and Queries/Logs. A check is a diagnostic signal; it does not by itself identify the cause of a problem or guarantee a performance outcome.
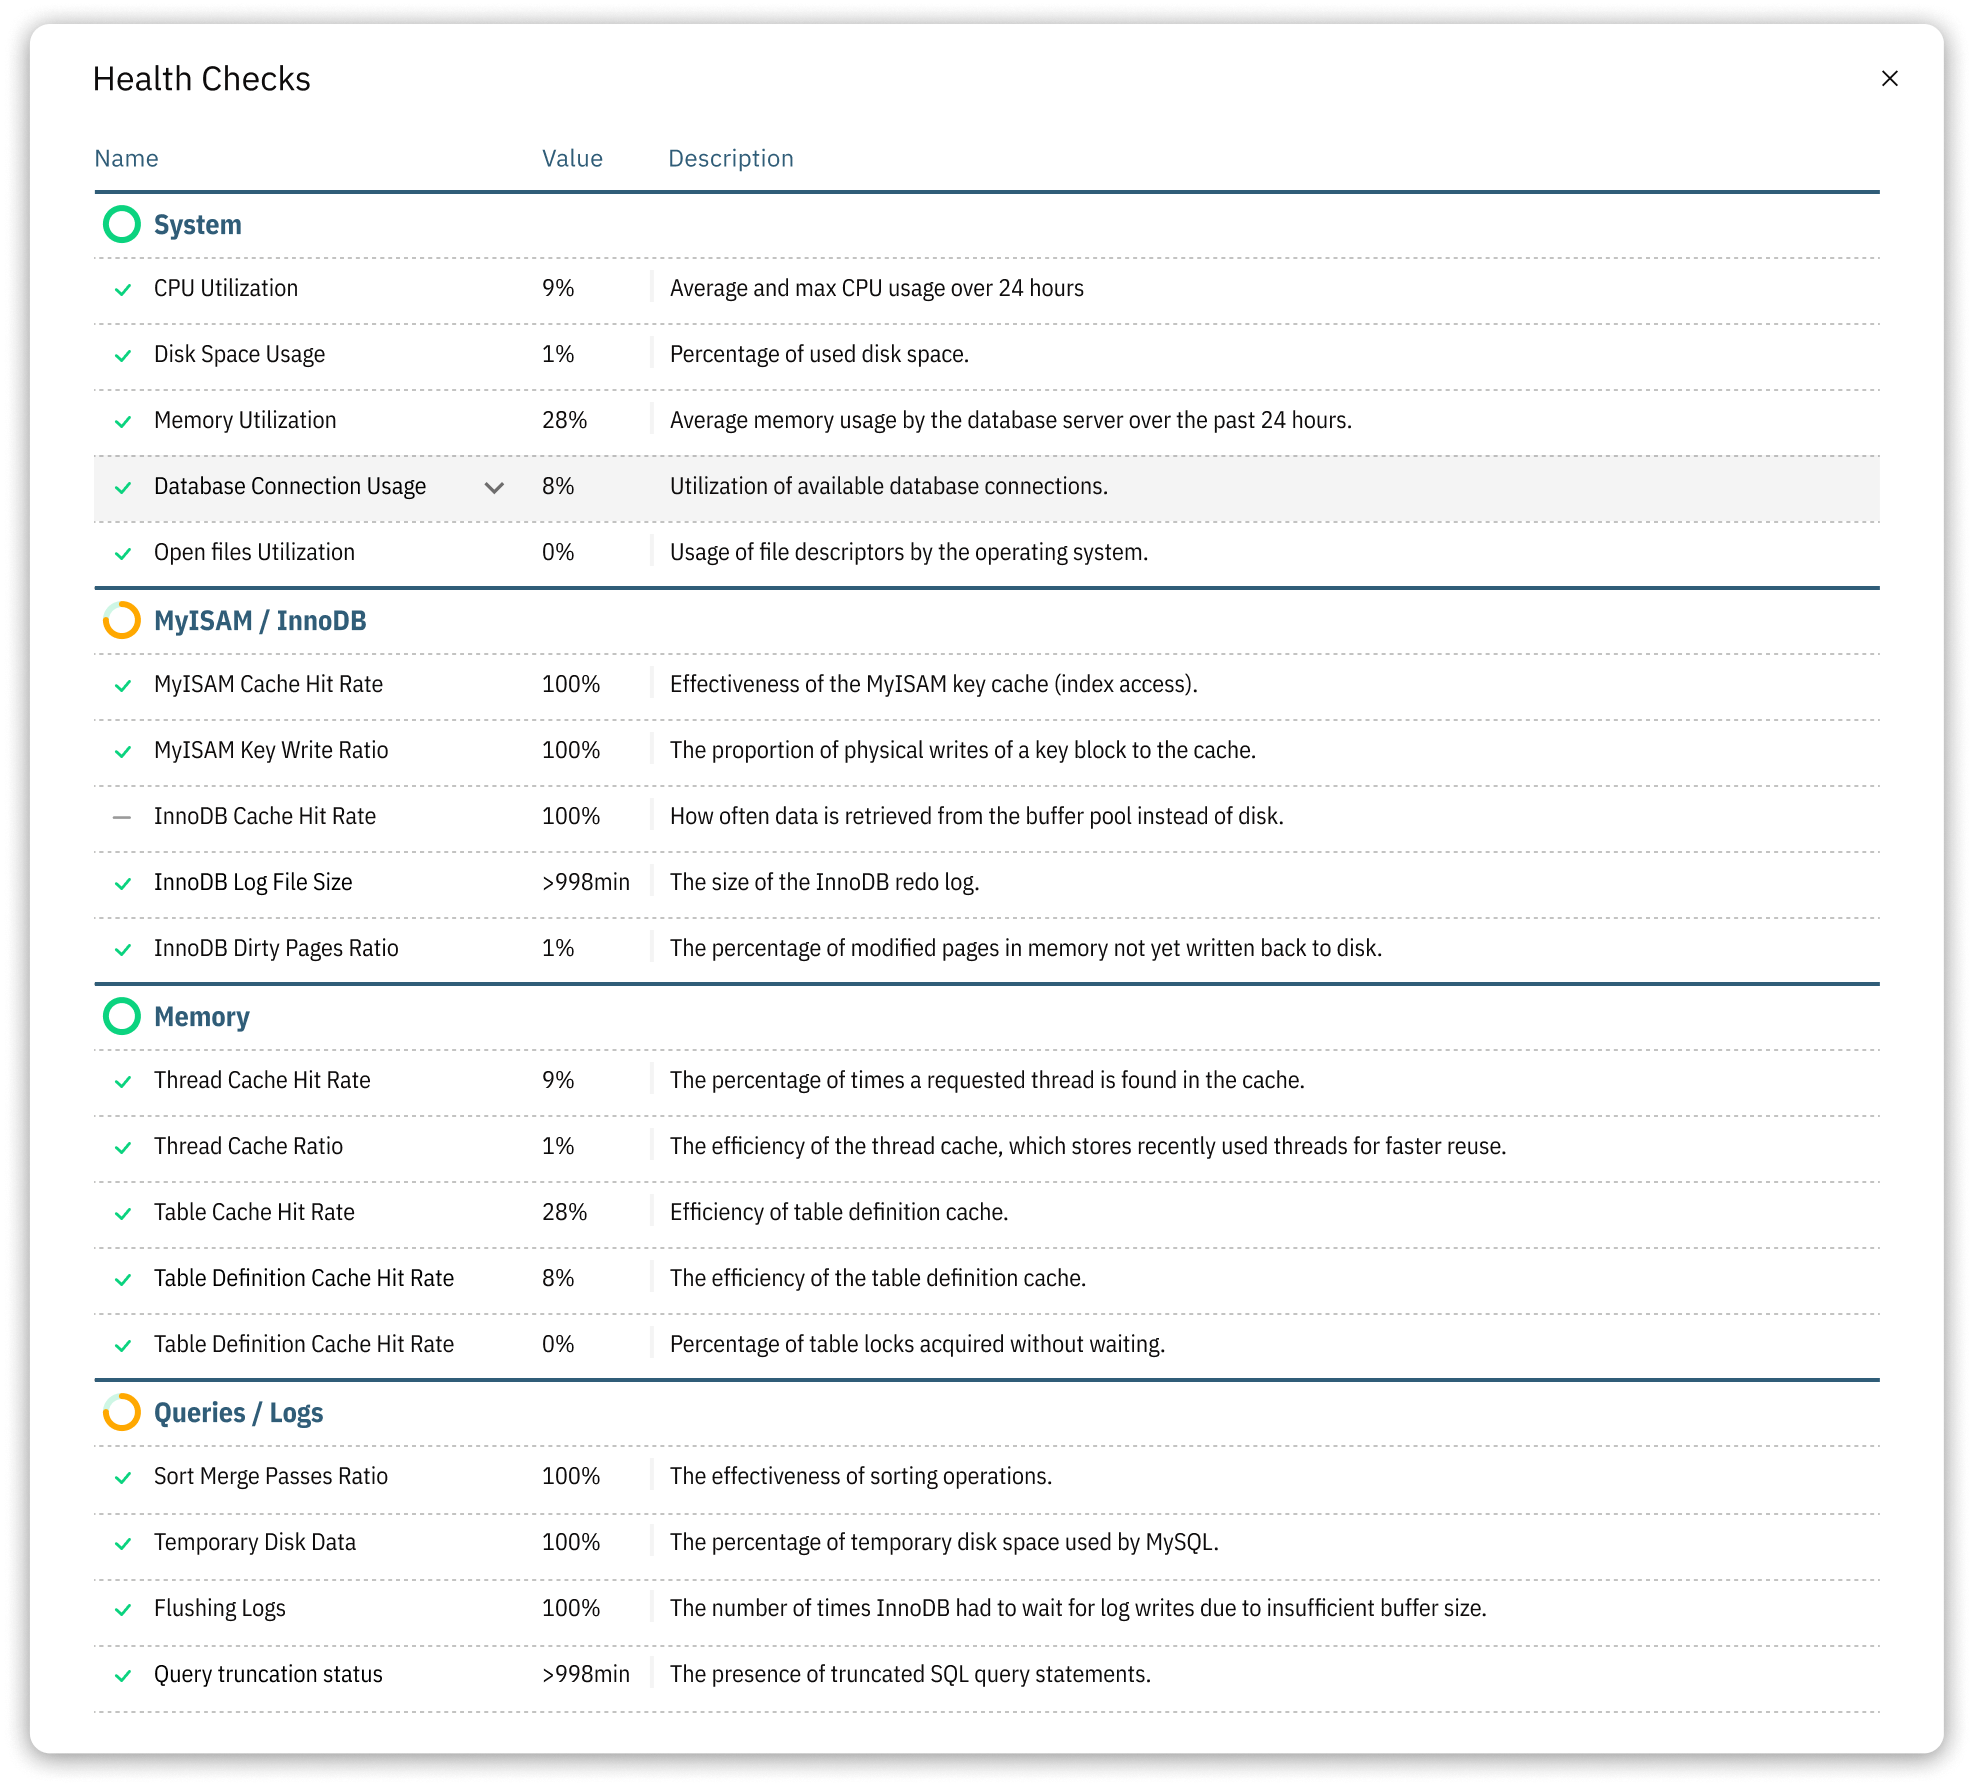
System Block
The System block shows essential system-level metrics for reviewing the overall state of your server.
- CPU Utilization: Measures the percentage of CPU capacity being used.
- Memory Utilization: Monitors the percentage of memory usage on the server.
- Disk Space Usage: Tracks the amount of disk space being used and helps identify potential storage issues.
- Database Connection Utilization: Monitors the percentage of connections used out of the total available connections.
MyISAM/InnoDB Block
The MyISAM/InnoDB block focuses on specific storage engines and their related metrics.
- MyISAM Cache Hit Rate: Measures the efficiency of the MyISAM key cache.
- MyISAM Key Write Ratio: Monitors the ratio of key writes to key write requests for MyISAM tables.
- InnoDB Cache Hit Rate: Assesses the effectiveness of the InnoDB buffer pool.
- InnoDB Log File Size: Monitors the size of the InnoDB log files as an input to performance review.
Memory Block
The Memory block checks metrics related to memory usage and allocation.
- Thread Cache Hit Rate: Evaluates the effectiveness of the thread cache.
- Thread Cache Ratio: Monitors the ratio of threads created to connections.
- Table Cache Hit Rate: Measures the efficiency of the table cache.
Queries/Logs Block
The Queries/Logs block examines metrics associated with queries and logs.
- Sort Merge Passes Ratio: Measures the ratio of merge passes to sorts performed.
- Temporary Disk Data: Monitors the amount of temporary data written to disk during query execution.
- QCache Fragmentation: Tracks the fragmentation level of the query cache.
- Flushing Logs: Tracks the frequency of log flushing, which can impact server performance.
Use these metrics to decide where to investigate further. Review a check with other server and workload evidence before acting on a Releem recommendation. A Health Check does not by itself prove the cause of a problem or guarantee that a change will improve performance.