Dashboard
Use the Dashboard to review what Releem currently observes about your database server. Dashboard metrics and checks describe observed state; they do not apply a change. Open Recommendations separately to review actions proposed from those observations.
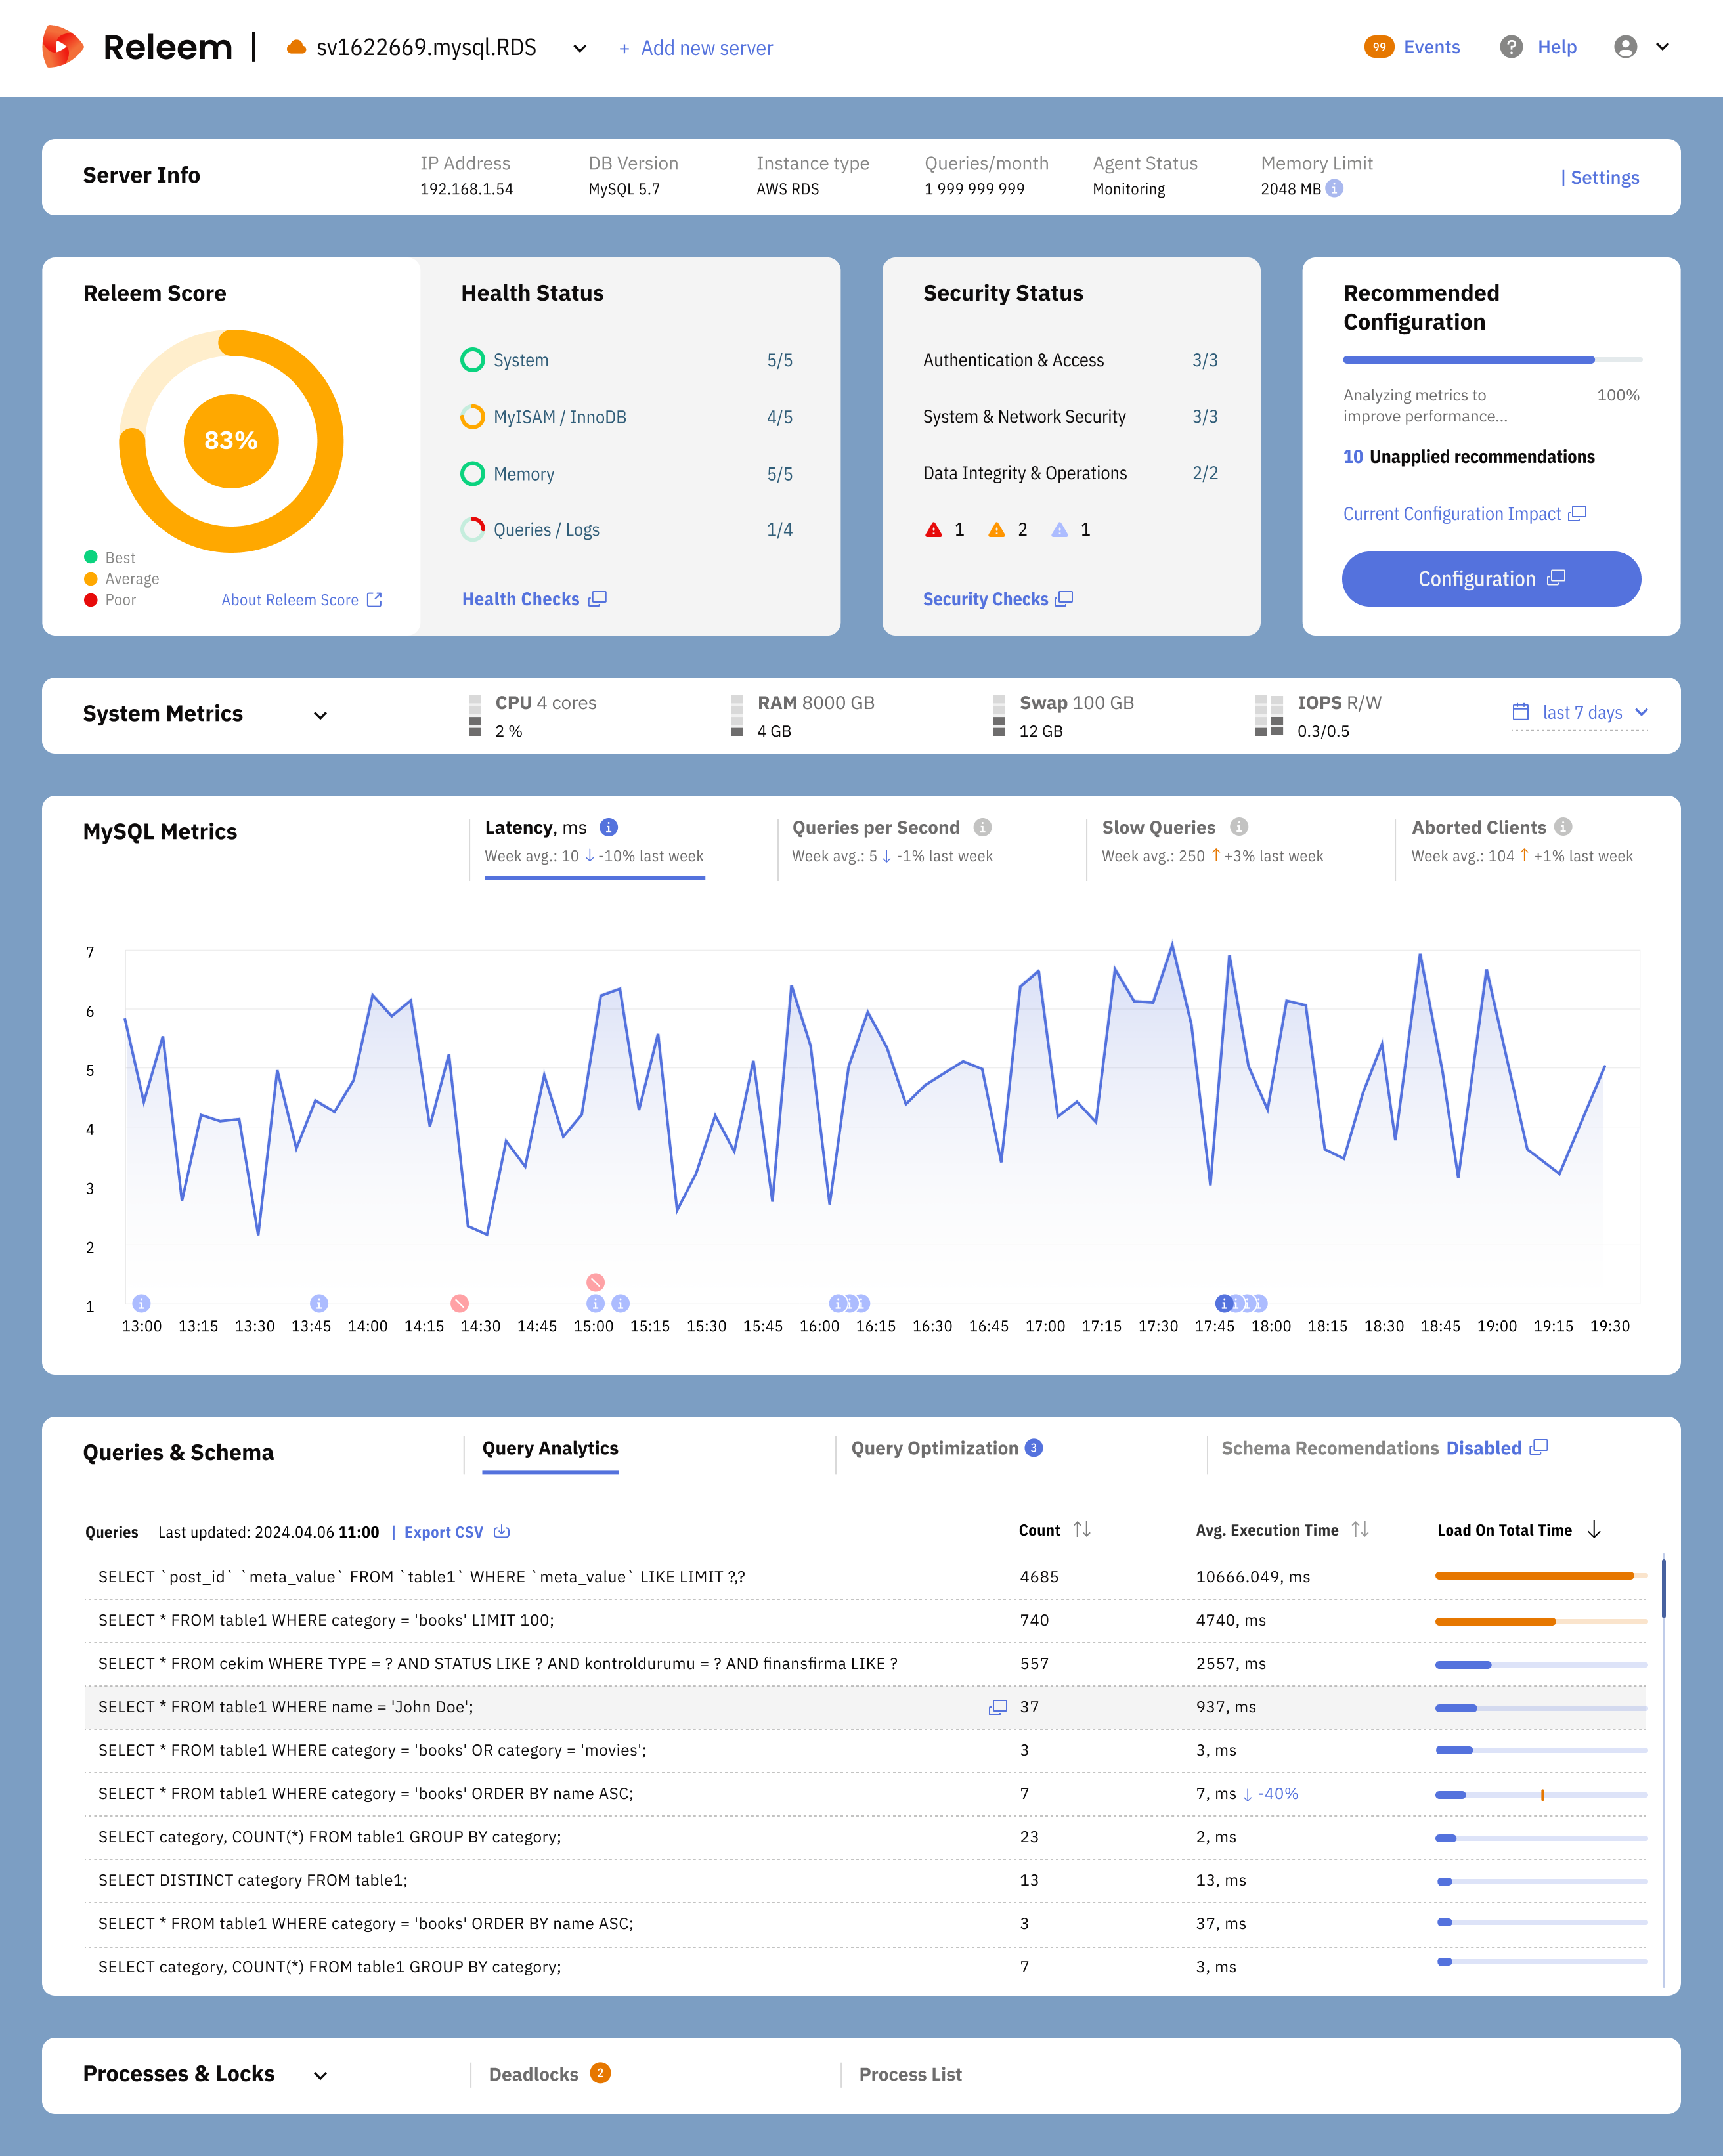
Start with the Releem Score and data freshness. Then open the block that matches your task: Query Analytics, Schema Checks, Deadlocks, Health Checks, Security Checks, Process List, or Reports. The sections below explain each Dashboard area.
1. Releem Score
The Releem Score block displays the server's status and Releem Score, representing the best practices (health checks) for maintaining servers. The score provides a quick overview of your server's health, allowing you to assess its performance at a glance.
2. Configuration Tuning
The Recommended Configuration block summarizes proposed configuration changes. Open Configuration Tuning to understand the recommendation workflow, then review the proposal and choose an application method before you make a change.
3. Performance Monitoring
The Performance Metrics block displays key instance metrics, such as CPU usage, Memory Usage, Swap usage, and IOPS. Monitoring these metrics helps you keep a close eye on your server's performance. Clicking on a metric displays a daily graph, offering a visual representation of the metric's performance over time.
The Database Metrics consists of several charts, including:
- Latency: This graph shows the P95 Latency, indicating the query execution time.
- QPS (Queries Per Second): A measure of the number of queries processed per second.
- Slow Log Queries: This graph displays the number of slow queries, helping you identify performance bottlenecks.
4. Query Optimization and Schema Checks
- Query Analytics tab provides insights into your database's performance by analyzing top and slow queries, including execution statistics, to help identify and resolve bottlenecks.
- Query Optimization tab offers automatic recommendations, such as index suggestions and query enhancements, to improve efficiency and reduce resource usage.
- Schema Checks tab ensures your database structure remains optimized through automated reviews that detect inefficiencies and suggest actionable improvements.
5. Processes & Locks
- Deadlock Monitoring continuously monitors your MySQL database for deadlocks, providing instant notifications with complete transaction details to help you quickly identify and resolve locking conflicts.
- Process List offers real-time visibility into all active database connections and running queries, allowing you to identify long-running queries, detect stuck processes, and troubleshoot bottlenecks directly from your dashboard.
6. Health Checks
Health Checks are diagnostic tests that evaluate a server's health, performance, and stability. Regular Health Checks are essential for ensuring optimal database server operation and meeting business requirements. Releem performs health checks twice a day, providing users with up-to-date insights into their database's current state.
7. Security Checks
Releem's Security Checks continuously monitor your MySQL database for security vulnerabilities and misconfigurations. This feature detects critical issues such as weak authentication, excessive privileges, anonymous users, remote root access, and insecure configurations, helping you maintain a secure database environment and comply with security best practices.